Costly errors
Hand-offs between siloed tools introduce mistakes that surface after ground break — exactly when they are most expensive to fix.
AI-first energy infrastructure platform
Stop guessing. Start modeling. SCOP turns your racks, loads, DERs and tariffs into one live electrical model — for data centers, microgrids, C&I facilities and EV fleets.
Why SCOP
Energy infrastructure — data centers, C&I facilities, fleet electrification — is among the most capital- and time-intensive investments an organization can make, and once built it is difficult and expensive to change. Yet the engineering behind it still runs on disconnected spreadsheets, scattered simulation tools, manual calculations and siloed workflows.
Hand-offs between siloed tools introduce mistakes that surface after ground break — exactly when they are most expensive to fix.
Every design change and every what-if question costs weeks of manual re-modeling, re-calculating and re-drawing.
Systems sized on assumptions instead of simulation underperform from the moment they are switched on.
Nowhere are the stakes higher than in data centers, where power availability and cost directly determine project viability.
Workflow
Select racks, IT loads, DERs and power infrastructure. SCOP builds the electrical model of the entire site — automatically.
Run power flow, dispatch and outage scenarios. Test what-ifs across load, tariffs, equipment and phasing — risk-free.
Compare every configuration on CAPEX, OPEX, TCO, ROI and payback, then export EPC-ready documentation.
Hand the validated strategies to the EMS — peak shaving, smart charging and resilience, proven before go-live.
Solutions
The same live model, techno-economics and EMS — applied wherever power decides whether a project works.
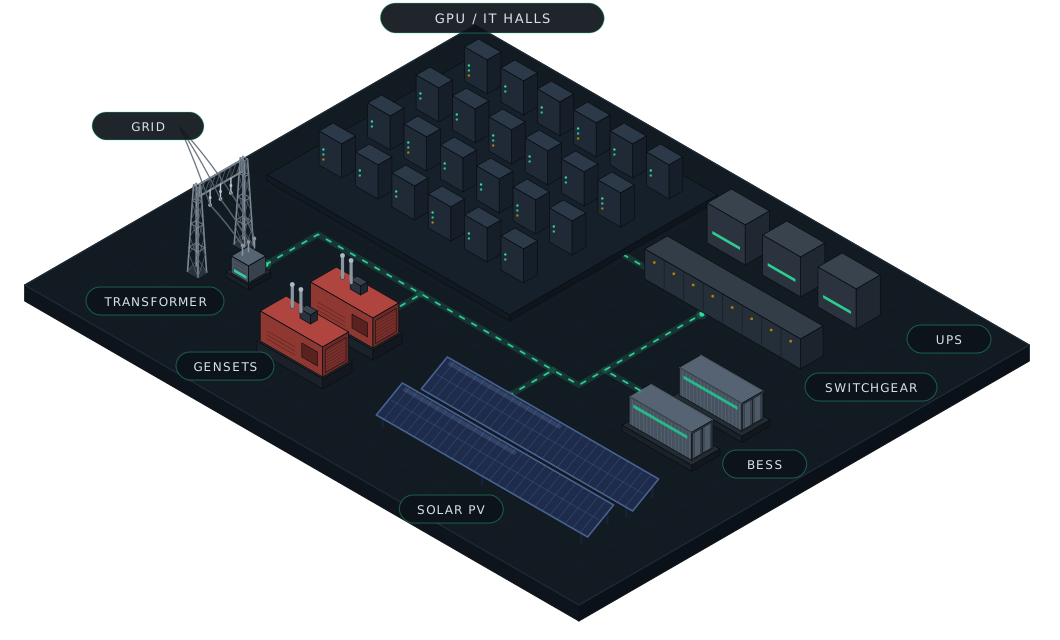
White space, gray space and outdoor power designed as one system — from racks and IT loads to gensets, BESS, switchgear and the utility feed. Prove power availability, cost and timeline before committing land or capital.
See the data center workflow →Design distributed energy on the real parcel — solar, BESS, gensets and hydrogen — then simulate dispatch, islanding and resilience before a single asset is deployed.
Explore DER site design →Size behind-the-meter DERs against your actual tariff to cut demand charges and utility bills — with savings proven over a 20-year horizon, not promised.
See the economics →Plan depots, chargers and grid upgrades on the real site — smart-charging strategies, feeder and trench costs, and utility coordination in one model.
Plan the depot →Use cases
The same live model answers a different question depending on who's asking — resilience, bill savings, or bankable returns.
Find the lowest-cost design for remote power systems, microgrids and islanded utilities.
Cut energy costs and add resilience for grid-connected facilities and EV charging sites.
Maximize return on utility-scale storage systems, with or without solar or wind.
The platform
Everything downstream — 3D layouts, financials, drawings, dispatch — stays in sync because it is generated from the same live model.
Pick racks, IT loads and supporting infrastructure — SCOP assembles the electrical model of the site, from utility feed to the last feeder.
White space, gray space and outdoor infrastructure in one navigable environment — GPU halls, UPS, switchgear, gensets, BESS and PV.
CAPEX, OPEX, TCO, ROI and payback for every configuration — with what-if scenarios across load, tariffs, equipment and phasing.
Live single-line diagrams and EPC-ready drawings generated from the model and exported to AutoCAD and Visio — up to 20× faster.
Define tariffs, dispatch strategies, battery limits and resilience targets — then simulate behavior before anything is deployed.
Custom AI assists at every step — accelerating analysis and surfacing insights that would otherwise demand heavy manual effort.
Simulation & optimization engine
Model and optimize the technical and economic performance of utility-scale battery storage, solar and wind — independently or as hybrid systems — inside the same platform you already use for site design and financials.
Data centers
Select racks and IT loads and SCOP builds the complete campus around them: gensets, BESS, UPS, switchgear and the utility interconnection — modeled electrically and rendered in 3D, from the GPU hall to the substation fence.
The stakes behind the power strategy
Global data center electricity use already sits at 1–2% of total demand, and AI workloads are pushing that share up every quarter. Operators are pulled in three directions at once: hold down energy spend (power alone runs 30–40% of opex), hit corporate commitments for round-the-clock carbon-free supply, and never let a new energy asset put SLA-grade uptime at risk. On-site generation and storage can satisfy all three — but only when the design is grounded in real techno-economic modeling, not rules of thumb.
Power typically eats 30–40% of a data center's operating budget, and cooling-driven demand spikes can push demand charges past a quarter of the electricity bill on their own.
Annual renewable energy credits no longer satisfy hyperscalers and enterprise tenants — the ask now is round-the-clock carbon-free supply. On-site generation is one of the few ways to get there, with standards like ISO 50001 increasingly the expected paper trail.
Five-nines SLAs leave no room for a new energy asset to be the weak link — it has to raise reliability, never risk it. That's why battery storage is increasingly standing in for, or backing up, diesel generators.
Training and inference workloads are pushing power density past anything the grid was sized for. New campuses now need 50–100+ MW, and interconnection queues can't move fast enough without on-site generation to fill the gap.
Decision-grade modeling
SCOP gives data center teams a way to pressure-test on-site solar, storage and hybrid generation against real cost, resilience and carbon targets — before a single asset is specified, and without ever putting customer-facing uptime on the table.
Bring in your own 15-minute interval data — cooling swings, IT load ramps, maintenance windows and all. SCOP runs the full 8,760-hour year so seasonal patterns show up in the result, not just a typical day.
Size a battery once and value it across every job it does: shaving peak demand day to day, standing in as backup during an outage, and arbitraging price swings off-peak — with each revenue stream broken out on its own.
Find the least-cost blend of grid power, solar, fuel cells, gas generation and storage — with interconnection caps, demand charges and hour-by-hour grid carbon intensity factored into the answer, not bolted on after.
One project, worked through
A 20 MW colocation campus in Northern Virginia's data center corridor was carrying an $8.5M annual power bill, with $2.8M of it in demand charges alone — mostly from summer-afternoon cooling spikes. The parent company had already committed to 100% renewables by 2030, and tenants were starting to ask for auditable, hour-by-hour carbon data instead of annual certificates.
The team ran real 15-minute interval data through SCOP against the site's actual commercial tariff, then swept combinations of 3–8 MW of ground-mount and carport solar, 10–40 MWh of lithium-ion storage, and a 500 kW–2 MW natural gas fuel cell. Dispatch was tuned for demand-charge reduction and time-of-use arbitrage while holding a 2-hour battery reserve, with Federal ITC, MACRS depreciation and Virginia Clean Economy Act incentives built into the economics.
The model converged on 6 MW of solar, a 25 MWh / 10 MW battery and a 1 MW fuel cell — a design projected to save $3.2M a year, 38% off the bill: $2.1M from shaved demand charges, $700K from arbitrage, and $400K from fuel-cell baseload offset. Solar and fuel cell together cover 42% of annual load with carbon-free generation, penciling out to an 18% project IRR. The operator now points tenants to the analysis itself as evidence of its sustainability commitment.
| Location / client | Project type | Key result |
|---|---|---|
| Data center campus | On-site solar + BESS adopted at scale | Demand charges, sustainability mandates and grid constraints are the three drivers |
| Logistics facility | Solar + storage across large commercial roof and ground-mount sites | Same modeling approach carries over to data center campuses |
| Enterprise hyperscaler | 24/7 carbon-free energy strategy built around on-site generation | Findings referenced in corporate sustainability reporting |
| Colocation portfolio | DER optimization across a multi-site energy portfolio | Shows the demand for tariff-depth analysis in data center planning |
Microgrids · DERs · C&I · EV & fleet
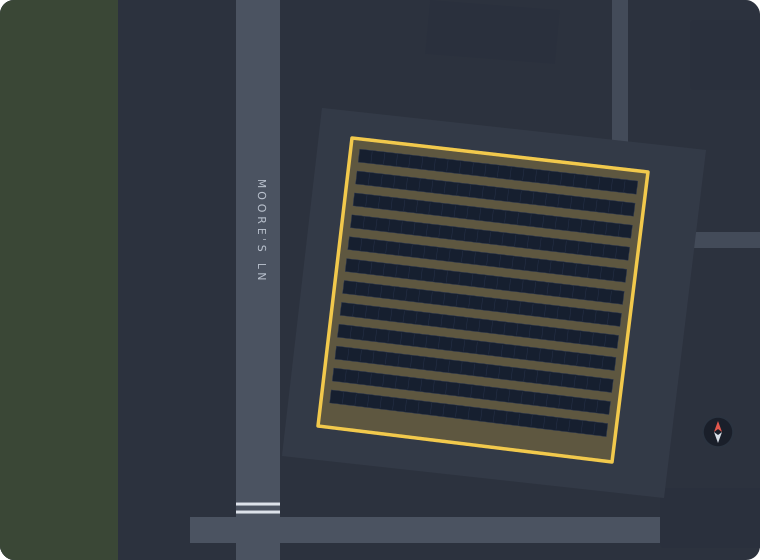
Drop solar, BESS, gensets, EV charging and buildings onto the actual parcel. The solar design tool takes an include area and an exclude area and does the rest — structure type, row-to-row spacing, GCR and automatic panel placement.
Advanced modules
Unlocks rate-dependent losses, capacity that shifts with temperature, variable depth-of-discharge for cycle life, and higher degradation rates at elevated temperatures.
Model sites with both AC and DC loads in the same system.
Represent deferrable loads such as pumping or HVAC.
For grid-connected systems with variable grid prices or a detailed grid specification, and off-grid systems where a future grid extension is possible.
Model real-time or time-of-use tariffs, standby charges and the economics of extending the grid to site.
For systems with fuel cells, remote off-grid operation, large industrial process loads, or any hydrogen production, storage or consumption.
Model systems that generate, store and consume hydrogen — from electrolyzers to fuel cells and blending.
EV charging · Fleet electrification
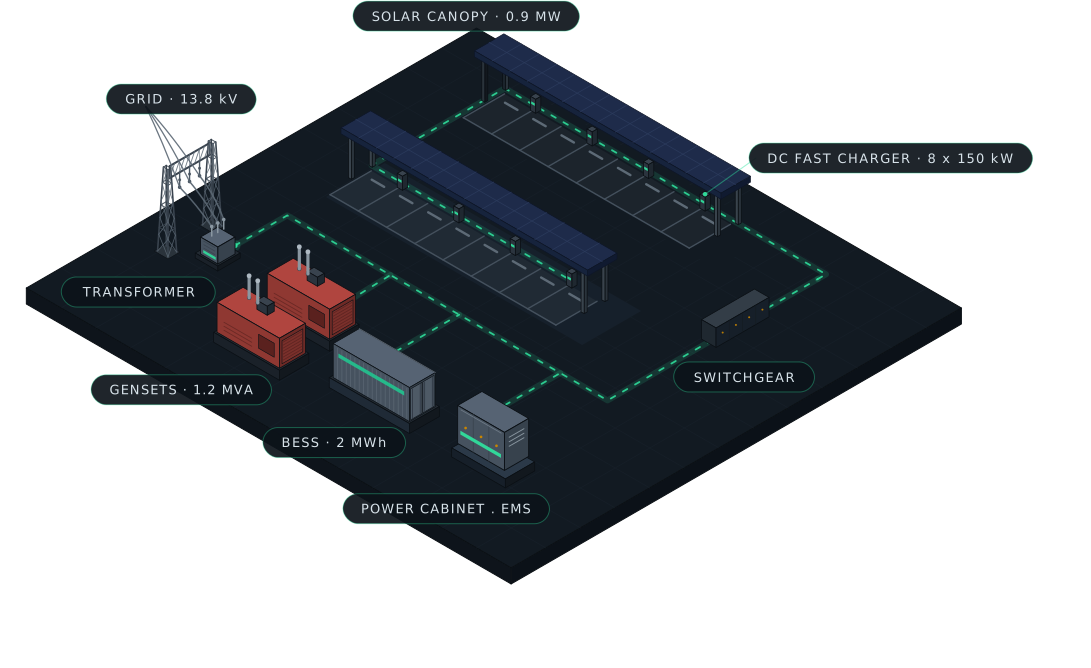
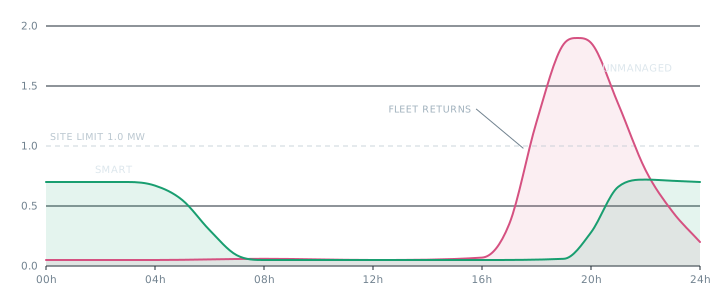
Design the whole depot on the real site — canopy solar over the stalls, a BESS, a standby genset and the 13.8 kV grid intake — then let the EMS prove a smart-charging strategy that runs the fleet on behind-the-meter power and keeps you inside the site limit the utility actually gave you.
Techno-economic analysis
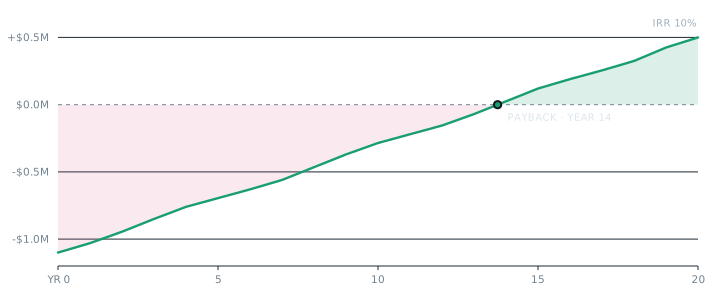
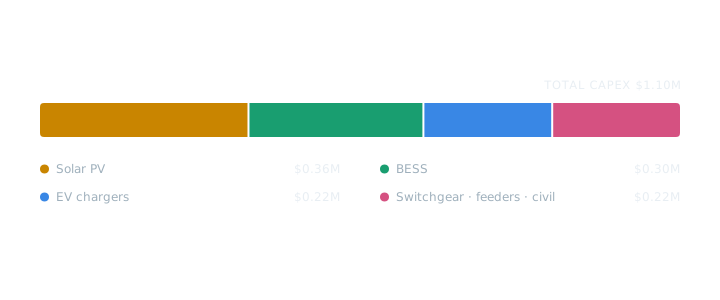
SCOP evaluates each design across CAPEX, OPEX, TCO, ROI and payback — every value stream, from demand-charge reduction and energy arbitrage to exports and capacity-as-a-service, priced under your actual tariff. What-if answers arrive in minutes, not weeks of re-modeling.
Microgrid recovers its investment in 14 years at a 10% internal rate of return — the grid-only baseline never pays back.
≈ 73% lifetime energy-cost savings across the 20-year horizon.
Re-runs instantly under any tariff or dispatch scenario.
Energy Management System
The configurable EMS layer lets operators define tariffs, dispatch strategies, battery limits and resilience targets — then watch the system behave across a full day, season or outage before a single asset is commissioned.
Live EMS telemetry — flows above zero serve the load · below zero the battery charges or power exports. Drag to pan · scroll to zoom.
Who it's for
Prove power availability, cost and timeline before committing land or capital.
Replace spreadsheet silos with a shared, simulation-backed model of every project.
Generate construction-ready drawings from the model and cut documentation cycles 20×.
Plan depot electrification, chargers and grid upgrades on the real site, with real tariffs.
Evaluate interconnection, DER hosting and tariff scenarios on a common live model.
Underwrite projects on simulated cash flows and sensitivities, not static assumptions.

Bring a site, a load profile or just a concept — we'll model it live in a working session, on an MVP you can drive yourself.